


IB Physics Tuition: How to Improve Practical and Data Questions
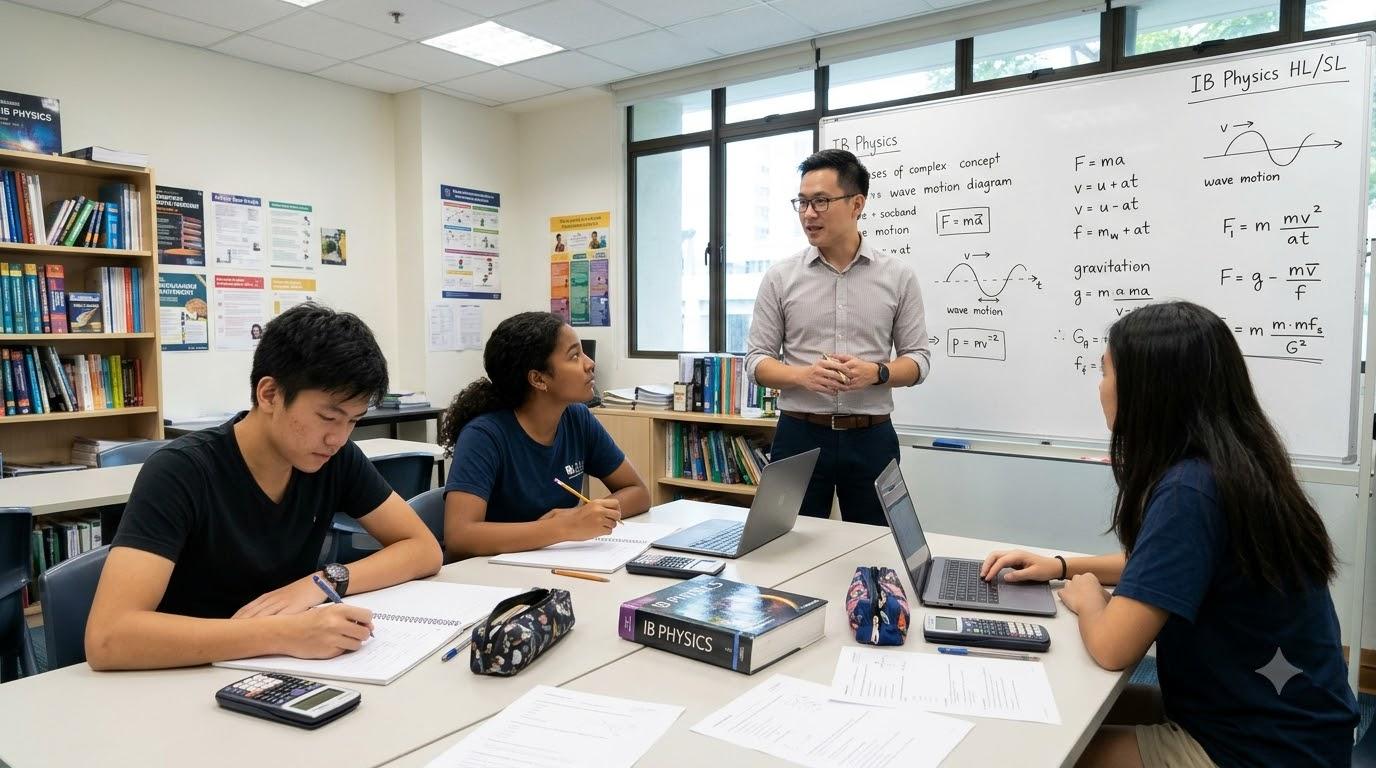
How to Get Better at Physics Practicals, Graphs, and Experimental Questions
Students can understand physics theory and still find experimental questions difficult. The challenge often lies in interpreting unfamiliar data, identifying variables, explaining patterns, and recognising the limitations of measurements. Focused ib physics tuition in Singapore for practical skills and data interpretation can help students develop a systematic approach to these questions instead of relying on memorised definitions alone.
Experimental questions reward careful reasoning. Students must distinguish what an experiment measures from what they expect it to show, use evidence to support conclusions, and recognise when the available data are insufficient to establish a claim.
These skills can be practised independently, even when students do not have access to a full laboratory outside school.
Why Experimental Questions Cause Problems
Practical questions combine scientific knowledge with measurement and interpretation. Students may understand a relationship theoretically but struggle to apply it when the results do not follow a perfectly smooth pattern.
Confusing the aim with the result
An experiment's aim describes what the investigation intends to examine. The result describes what the measurements actually show.
For example, an experiment might investigate the relationship between the length of a pendulum and its period. The aim does not prove that the measurements will follow the expected relationship. Students must examine the data before stating a conclusion.
Forgetting to identify variables
Experimental design often requires distinguishing the independent variable, dependent variable, and controlled variables.
If a student investigates how wire length affects electrical resistance, wire length is the independent variable and resistance is the dependent variable. The wire's material, temperature, and cross-sectional area may need to be controlled.
If these factors change unexpectedly, the experiment may not provide a reliable test of the intended relationship.
Describing a graph without interpreting it
Writing that a graph increases from left to right may describe a visible trend, but it may not explain the scientific meaning.
Students should connect the observed relationship to the relevant physics model and identify what can reasonably be inferred from the data.
A Reliable Method for Analysing Experimental Data
Use the same sequence whenever you encounter an unfamiliar experiment.
First, identify the investigation. Read the aim and determine which relationship or physical quantity is being examined.
Second, identify the variables. Work out what is changed, what is measured, and what needs to remain constant.
Third, inspect the measurements. Check units, scales, significant figures, and whether the data contain unusual values.
Fourth, describe the pattern. Identify whether the relationship appears linear, curved, proportional, inversely related, or more complicated.
Fifth, connect the pattern to physics. Use the relevant equation or model to explain the relationship, while recognising any assumptions.
Finally, evaluate the evidence. Consider uncertainty, repeat measurements, experimental limitations, and whether the results support the conclusion.
This sequence makes it easier to organise an answer without adding unnecessary detail.
Understanding Graphs and Gradients
Graphs are particularly useful because they can reveal relationships that are difficult to see from a list of numbers.
However, the meaning of a gradient depends on the quantities shown on the axes.
For a displacement–time graph, the gradient represents velocity. For a velocity–time graph, the gradient represents acceleration. The signed area beneath a velocity–time graph represents displacement.
Students should learn these relationships alongside the relevant units.
How to calculate a gradient
When a question asks for a gradient, choose two well-separated points on the straight line or best-fit line, as appropriate.
Calculate:
Gradient=Change in vertical quantityChange in horizontal quantity\text{Gradient}=\frac{\text{Change in vertical quantity}}{\text{Change in horizontal quantity}}Gradient=Change in horizontal quantityChange in vertical quantity
Use the axis units to determine the gradient's units.
For example, if displacement is measured in metres and time in seconds, the gradient of a displacement–time graph has units of metres per second.
Do not automatically use two adjacent experimental points. A best-fit line may provide a more suitable estimate when the measurements contain uncertainty.
Interpreting a curved graph
A curved graph suggests that the relationship changes across the range of measurements.
Students should describe the trend and determine whether the question requires an average rate of change or a rate at a particular point. These are not always the same.
Avoid forcing a straight-line explanation onto data that clearly show curvature.
Measurement Uncertainty and Experimental Reliability
Measurements are never perfectly exact. Instruments have finite resolution, and experimental procedures can introduce variation.
Students should understand the difference between uncertainty and error.
Uncertainty describes the range of values reasonably associated with a measurement. An error can refer to a difference between a measured value and a reference value, or to a systematic issue affecting measurements.
Random and systematic effects
Random variations can cause repeated measurements to differ. Repeating measurements and calculating an appropriate average may help reduce the effect of random variation.
Systematic effects shift measurements consistently in one direction. Repeating the same measurement does not necessarily remove such an effect.
For example, an instrument that has not been zeroed correctly may produce consistently offset readings.
The appropriate improvement depends on the limitation being addressed. Students should explain the connection between the identified problem and the proposed solution.
How to Design a Stronger Experiment
A well-designed experiment isolates the relationship being investigated and produces measurements suitable for analysis.
Follow this process:
-
State the aim clearly. Identify the variables whose relationship you want to investigate.
-
Select suitable equipment. Choose instruments with an appropriate range and resolution.
-
Control relevant conditions. Keep other influential variables as constant as practical.
-
Collect multiple measurements. Repeat readings where appropriate to assess variation.
-
Use a suitable measurement range. Collect enough data to identify the relationship, within safe and practical limits.
-
Record units and conditions. Include enough information for another person to understand the procedure.
-
Analyse the data. Use a graph or calculation suited to the relationship being studied.
-
Evaluate the method. Identify specific limitations and suggest realistic improvements.
The quality of an experiment depends on how well its design answers the research question, not on how complicated the equipment appears.
Comparing Experimental Improvements
|
Experimental problem |
Possible improvement |
Why it may help |
Limitation |
|
Inconsistent readings |
Repeat measurements |
Helps reveal variation |
Does not remove systematic effects |
|
Instrument resolution too low |
Use a more suitable instrument |
May improve measurement detail |
Equipment may have practical limits |
|
Uncontrolled temperature |
Monitor or control temperature |
Reduces a potential confounding influence |
Perfect control may be difficult |
|
Too few data points |
Collect additional measurements |
Helps reveal the relationship |
Requires more time |
|
Unclear graph trend |
Use an appropriate best-fit line or curve |
Helps summarise the pattern |
The model must suit the data |
|
Human reaction-time variation |
Use electronic timing where appropriate |
Can reduce reaction-time effects |
Setup and instrument limitations remain |
Students should select improvements based on the actual problem rather than listing generic suggestions.
How to Write Evidence-Based Conclusions
A scientific conclusion should address the question and reflect the evidence.
Suppose an investigation examines how the length of a wire affects its resistance. A suitable conclusion would describe the pattern observed in the data and state whether it is consistent with the expected relationship under the experimental conditions.
If the data are scattered, acknowledge that limitation. If only a narrow range of lengths was tested, avoid making broad claims about all possible wire lengths.
The distinction between correlation and causation is also important. Observing that two quantities change together does not, by itself, establish that one directly causes the other.
Illustrative Case Study: An Experiment With Inconsistent Timing Results
Initial problem: A hypothetical student records different times for an object travelling the same distance during repeated trials.
Circumstances: The student uses a handheld stopwatch and begins or stops timing at slightly different moments.
Solution: The student reviews the measurement procedure and considers how timing uncertainty affects the result.
Steps taken:
-
Repeat the measurements under similar conditions.
-
Record each reading rather than selecting only the preferred result.
-
Calculate an appropriate average.
-
Consider whether an electronic timing method is available.
-
Compare the variation in the measurements.
-
Explain the limitations when drawing a conclusion.
Expected outcome: The student should gain a clearer understanding of measurement variation and how experimental procedures influence confidence in results. The exact improvement depends on the equipment and the remaining sources of uncertainty.
Practical lesson: A difference between measurements is not automatically evidence that the ib physics theory is wrong. The method and uncertainty must also be examined.
Building Experimental Skills Into Your Revision
Practical questions should be included in regular study sessions rather than left until the final days before an assessment.
A useful weekly routine might include one session on graphs, one on experimental design, and one on data-based exam questions. After each session, record the mistakes that need attention.
For students who need additional academic guidance, IB-DP's homepage provides a starting point for exploring its educational information and support options.
Additional instruction can be helpful when it includes clear explanations, realistic experimental scenarios, and feedback on how scientific conclusions are written. Students should still practise interpreting data independently.
Conclusion
Strong experimental answers depend on careful measurement, correct graph interpretation, clear explanations, and honest evaluation of limitations.
When faced with an unfamiliar question, identify the aim, examine the variables, interpret the data, connect the findings to physics, and evaluate how reliable the conclusion is. Practise these steps regularly and review errors to identify the skills that need further work.
Frequently Asked Questions
Why are physics experimental questions difficult?
They require students to combine theory with measurement, data interpretation, experimental design, and evaluation of uncertainty.
How can I improve graph interpretation?
Check the axes and units, identify the trend, calculate gradients or areas where appropriate, and explain the physical meaning of the result.
What is the difference between random and systematic effects?
Random variation can cause measurements to fluctuate, while a systematic effect can shift measurements consistently. The appropriate method of reducing each problem differs.
Why should an experiment include repeated measurements?
Repeated measurements can help reveal variability and support a more reliable estimate. They do not automatically remove systematic effects.
How should I evaluate an experiment?
Identify a specific limitation, explain how it may affect the measurements or conclusion, and suggest a realistic improvement that addresses the limitation.
Can additional physics tuition help with practical questions?
It can help students understand experimental reasoning and practise data-based problems. Its value depends on the quality of instruction and independent practice.

 English
 Arabic
 French
 Spanish
 Portuguese
 Turkish
 Dutch
 Italiano
 Russian
 Romaian
 Portuguese (Brazil)
 Greek