


5 Trading Indicator Mistakes That Trigger False Signals Every Time
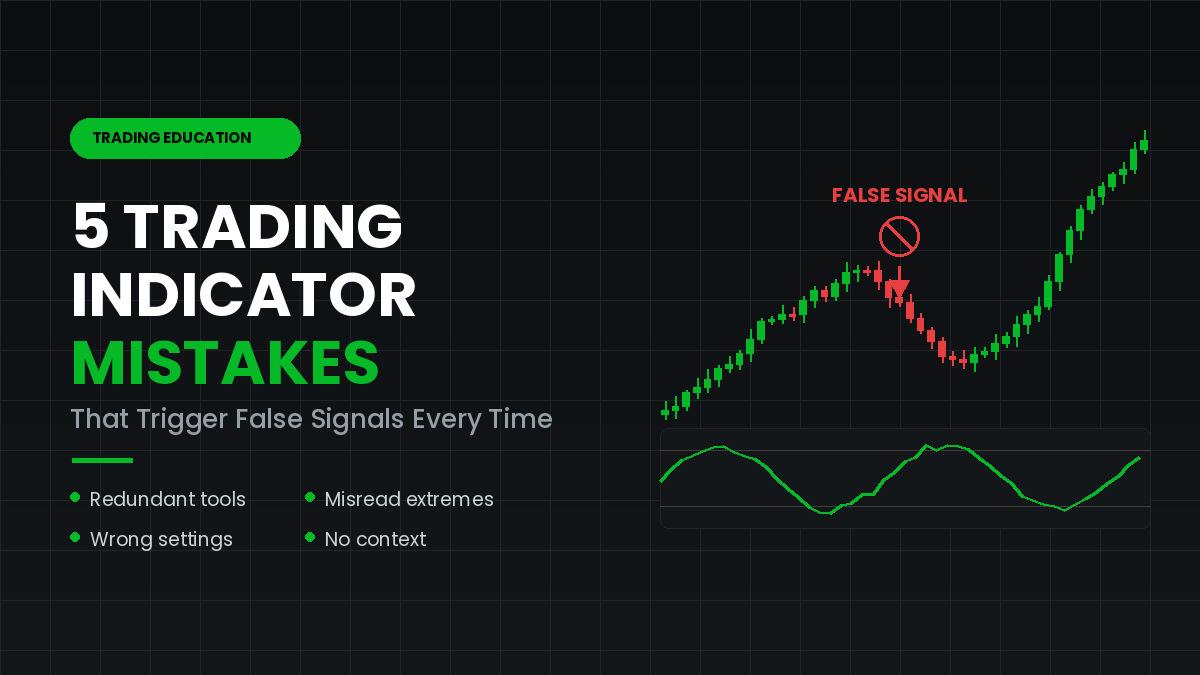
Every trader knows the feeling. The oscillator flashes a buy. Two moving averages cross. You take the entry with full confidence, and price turns against you within minutes. Moments later, the signal fades as if it never existed.
After two decades spent around charts, order flow and backtest reports, I can say this plainly. The indicator is rarely the problem. The way it gets used almost always is. In fact, the same trading indicator mistakes appear again and again in trading journals, and each one manufactures false signals with mechanical reliability.
This guide breaks down the five trading indicator mistakes that cause the most damage. More importantly, it shows what to do instead, so your charts start filtering noise rather than adding to it.
Why Indicators Produce False Signals in the First Place
First, a quick reality check. Every indicator is a mathematical summary of past price or past volume. Nothing more than that. RSI compresses recent gains and losses into a single number. Moving averages smooth old closing prices. MACD compares two of those averages.
Because of this design, indicators lag. They also simplify aggressively. One line cannot capture a liquidity gap, a surprise rate decision or a thin holiday session. Therefore, a "false signal" is often an accurate calculation applied to the wrong situation. In other words, most trading indicator mistakes are interpretation errors, not software errors.
Once you accept that, common indicator mistakes become far easier to spot. They also become far easier to fix.
Mistake 1: Stacking Indicators That Measure the Same Thing
Open a beginner's chart and you will usually find RSI, Stochastic, MACD and CCI running at once. The layout looks thorough. In reality, all four measure momentum from nearly identical price inputs.
As a result, they agree with each other constantly. That agreement feels like confirmation, yet it confirms almost nothing. You simply asked the same question four times and received the same answer four times.
This ranks among the most expensive trading indicator mistakes because it builds false confidence. Traders then size up on "confluence" that never really existed. When the move fails, four indicators fail together.
What to Do Instead
Build your layout from different data families. Choose one momentum tool, one trend tool and one volatility or volume tool. For example, pair RSI for momentum, a 50-period moving average for trend direction, and Average True Range for volatility.
Three indicators that sometimes disagree will teach you more than six that echo. In addition, a cleaner chart leaves room for the thing that actually pays you, which is price structure.
Mistake 2: Treating Overbought and Oversold as Automatic Sell and Buy Signals
RSI crosses 70. The candle looks stretched. So the trader shorts immediately.
Unfortunately, strong trends live inside overbought territory for long stretches. During the 2020 and 2021 crypto expansion, daily Bitcoin RSI held above 70 for weeks at a time. Traders who shorted every touch were run over repeatedly. The same pattern appeared in major equity indices through several extended rallies.
Overbought simply means momentum is unusually strong. It does not mean price must reverse. Oversold behaves the same way during a downtrend, where weak readings persist far longer than most people expect.
Among the mistakes traders make with indicators, this one produces the deepest drawdowns. After all, it places you directly against the dominant flow of money.
What to Do Instead
Read oscillators as context rather than commands. In a clear uptrend, treat oversold pullbacks as potential entries in the direction of the trend. Meanwhile, save short setups for moments when structure breaks, such as a failed higher high or a loss of a key moving average.
Divergence deserves the same caution. Momentum can weaken for a long time while price grinds higher. Consequently, wait for confirmation from price itself before acting on any divergence.
Mistake 3: Running Default Settings on Every Market and Every Timeframe
The classic settings, such as 14-period RSI, 20-period Bollinger Bands and 12-26-9 MACD, were chosen decades ago. They were tuned for daily bars in far slower markets. Today, those same defaults get applied to one-minute crypto charts and to weekly currency charts without a second thought.
Markets differ enormously in speed and character. A five-minute gold chart during the London open behaves nothing like a four-hour chart of a low-volatility utility stock. So one fixed setting cannot serve both.
Still, there is a trap on the other side. Endless tweaking until the backtest looks perfect is curve fitting, and it collapses in live trading. Both extremes belong on any honest list of common indicator mistakes.
What to Do Instead
Adjust settings deliberately, then test them properly. Start by matching the lookback period to the average holding time of your trades. Next, check whether the setting still performs on a different date range and on a related market. Finally, keep the change only if performance holds up outside the sample you optimised on.
In short, settings should be chosen once, with evidence, and then left alone for a meaningful stretch of trades.
Mistake 4: Acting on a Signal Before the Candle Closes
This mistake is subtle, yet it destroys otherwise solid systems. Most indicators recalculate on every tick. Therefore, a moving average cross can appear halfway through a candle and vanish before that candle closes.
Traders then enter on a signal that never actually printed, and this ranks high on any list of trading indicator mistakes. Later, they review the chart and cannot find the setup at all. Some scripts make matters worse by repainting historical signals, which produces a backtest that looks flawless and a live account that does not.
Learning how to avoid indicator mistakes starts with respecting the close. Your backtest almost certainly used closed candles, so your live execution should match it exactly.
What to Do Instead
Set alerts to fire on bar close instead of on every tick. Additionally, drop to a lower timeframe only for execution, never for the signal itself. If a strategy demands instant reaction, then test it honestly on tick data before risking capital.
Discipline here costs a few seconds. Consistency, on the other hand, is worth far more.
Mistake 5: Ignoring Volume, Volatility and Market Context
An indicator has no idea what day it is. It cannot tell whether a central bank speaks in ten minutes, or whether liquidity has thinned out during a public holiday. It processes numbers, and it does so without judgement.
Consequently, the same MACD cross means very different things in different environments. During the New York session on a high-volume day, that cross may carry real weight. At 3 a.m. in a dead range, it usually means nothing at all.
Range conditions deserve special attention. Trend indicators whipsaw badly when price chops sideways, and they generate a stream of small losses that grind accounts down slowly. Many traders blame the tool. The environment, however, was the real issue.
What to Do Instead
Add a context filter before any signal counts. Three simple filters work well for most people.
- Volatility filter: require ATR to sit above a minimum threshold, so you skip dead conditions.
- Session filter: trade only during hours when your market shows consistent participation.
- Structure filter: confirm that price respects a clear trend or a clear range before choosing a strategy.
Context filters like these remove a surprising number of losing trades. They also prevent the quiet, repetitive mistakes traders make with indicators during flat market hours. Better still, they remove them before you ever click the mouse.
How to Avoid Indicator Mistakes: A Simple Pre-Trade Checklist
Habits beat intentions. For that reason, run through a short checklist before every entry. This routine catches most trading indicator mistakes before they cost you money.
- Does each indicator on my chart measure something different?
- Does the signal point in the same direction as the higher timeframe trend?
- Has the candle actually closed?
- Is volatility high enough for this setup to work?
- Am I trading during a session with real participation?
- Do I know my exit and my risk before entry?
Six questions take about twenty seconds. Over a hundred trades, they will save you far more than any new indicator ever could.
Using Trading Indicators Correctly Comes Down to Expectations
Here is the mindset shift that separates consistent traders from frustrated ones. Indicators are measuring instruments, not fortune tellers. A thermometer tells you the temperature. It does not tell you what to wear.
Using trading indicators correctly means asking better questions of your tools. Is momentum expanding or fading? Is volatility rising or compressing? Is this market trending or ranging? Those answers guide decisions. Meanwhile, a simple buy or sell arrow rarely does.
Track your results honestly as well. Record the setup, the market condition and the outcome for every trade. After fifty entries, patterns emerge quickly. You will see which conditions favour your system, and you will see exactly where trading indicator mistakes keep creeping back in.
Finally, remember that no configuration removes uncertainty. Losses are part of a positive-expectancy system, so risk management always outranks signal quality. Position sizing protects you when the market ignores your analysis, which it will do regularly.
Frequently Asked Questions
How many indicators should I use on one chart?
Two or three is usually enough. Each one should answer a different question about the market. Beyond that point, charts get crowded and decisions get slower. Many common indicator mistakes trace back to clutter rather than to any single tool.
Which indicator gives the fewest false signals?
No indicator wins that contest on its own. Slower settings produce fewer signals, yet they also enter later. Faster settings react quickly, though they misfire more often. The right balance depends on your holding time, your market and your risk tolerance.
Can I remove false signals completely?
No, and chasing that goal leads to over-optimised systems. Instead, aim to reduce low-quality signals with context filters and clear rules. Understanding how to avoid indicator mistakes will improve your win rate far more than searching for a perfect tool.
Do these problems apply to automated strategies too?
Yes, and trading indicator mistakes often hurt automated systems more severely. Code executes exactly what it is told, so a flawed assumption repeats without hesitation. Automated systems therefore need honest, closed-bar testing on out-of-sample data before they go live.
Final Thoughts
False signals feel random when you stand too close to them. Step back, though, and the pattern becomes obvious. Redundant indicators, misread extremes, careless settings, premature entries and missing context explain the overwhelming majority of them.
Fix these trading indicator mistakes and your charts change character immediately. Signals become fewer, yet each one carries more meaning. That trade-off sits at the heart of every durable trading approach.
Educational resources from teams like GainzAlgo can help traders study these concepts in more depth, though the real progress comes from your own review process. Test your changes, keep detailed notes, and let evidence guide each adjustment. Trading always carries risk, so treat every improvement as a small edge rather than a guarantee.

 English
 Arabic
 French
 Spanish
 Deutsch
 Turkish
 Dutch
Dutch
 Italiano
 Russian
 Romaian
 Portuguese (Brazil)
 Greek
Greek